Thinking about adding an industrial or flex asset in Fremont to your portfolio? You are looking at one of the Bay Area’s most durable advanced manufacturing hubs. In this guide, you will get a clear read on local demand drivers, current rents and vacancy, what product types work, how leases pencil, and a practical underwriting checklist. You will also see exit scenarios and local due diligence items that can make or break a deal. Let’s dive in.
Why Fremont stands out for industrial investors
Fremont’s industrial story is not an accident. The city has protected and expanded land for tech‑industrial uses and built out employment districts that serve modern manufacturing and R&D. That policy choice has supported a dense cluster of hardware, EV, and AI‑server users who want to be near talent and suppliers.
Strategic location and land policy
Fremont sits at the southern end of the I‑880 corridor with direct access to I‑680 and SR‑237, plus proximity to the Port of Oakland and Oakland International Airport. The city has designated employment districts like the Warm Springs Innovation District and Bayside Technology Park, and it actively markets them to advanced manufacturers. You can see this focus on the City’s economic development page that outlines real estate and investment priorities for employers and builders. Review the City’s emphasis on industrial and R&D districts on the City of Fremont’s economic development page at fremont.gov.
Advanced manufacturing cluster and demand
Local reporting highlights Fremont as one of the Bay Area’s largest advanced manufacturing hubs, with a heavy concentration of EV, battery, contract manufacturing, and AI‑server hardware suppliers. That cluster effect attracts tenants that demand more power, higher floor loads, and flexible R&D features. Read more on Fremont’s industrial evolution in the San Francisco Chronicle’s coverage.
Current market snapshot in 2025
Market conditions have normalized from the 2021 to 2023 peak, but the East Bay remains resilient by product type. In 2025, reported industrial vacancy across the Oakland‑Hayward‑Berkeley submarket generally sits in the mid‑single to low‑teens depending on the slice, with tighter conditions for infill Class A and advanced manufacturing space. Broker reports cluster average asking rents in the East Bay around $1.30 to $1.62 per square foot per month NNN, with premiums for modern Fremont R&D and advanced manufacturing product. See the latest ranges in Kidder Mathews’ East Bay industrial report.
Leasing is segmented. Larger institutional deals over 100,000 square feet have focused on Fremont, Newark, and nearby nodes. At the same time, small‑bay and mid‑bay suites in the 5,000 to 50,000 square foot range remain active for light manufacturing, service, and local logistics. For a snapshot of who is taking space and where, review CBRE’s Oakland industrial Figures.
Supply pipeline and preleasing
Developers are delivering new advanced manufacturing campuses in Fremont to meet power‑intensive user needs. Recent projects such as the Campus at Bayside and other modern parks are designed with heavy power, higher clear heights, and enhanced fire protection. One Fremont park publicized 4,000 amp service per building, which shows how the spec has shifted for AI hardware and EV‑related tenants. Get a feel for current specs and activity in CBRE’s Bayside Manufacturing Park release. New supply is meaningful on infill sites, but developable land remains constrained, which supports long‑run fundamentals.
What you can buy in Fremont
The right product type depends on your return goals, risk tolerance, and leasing strategy. Here is a quick guide to common options:
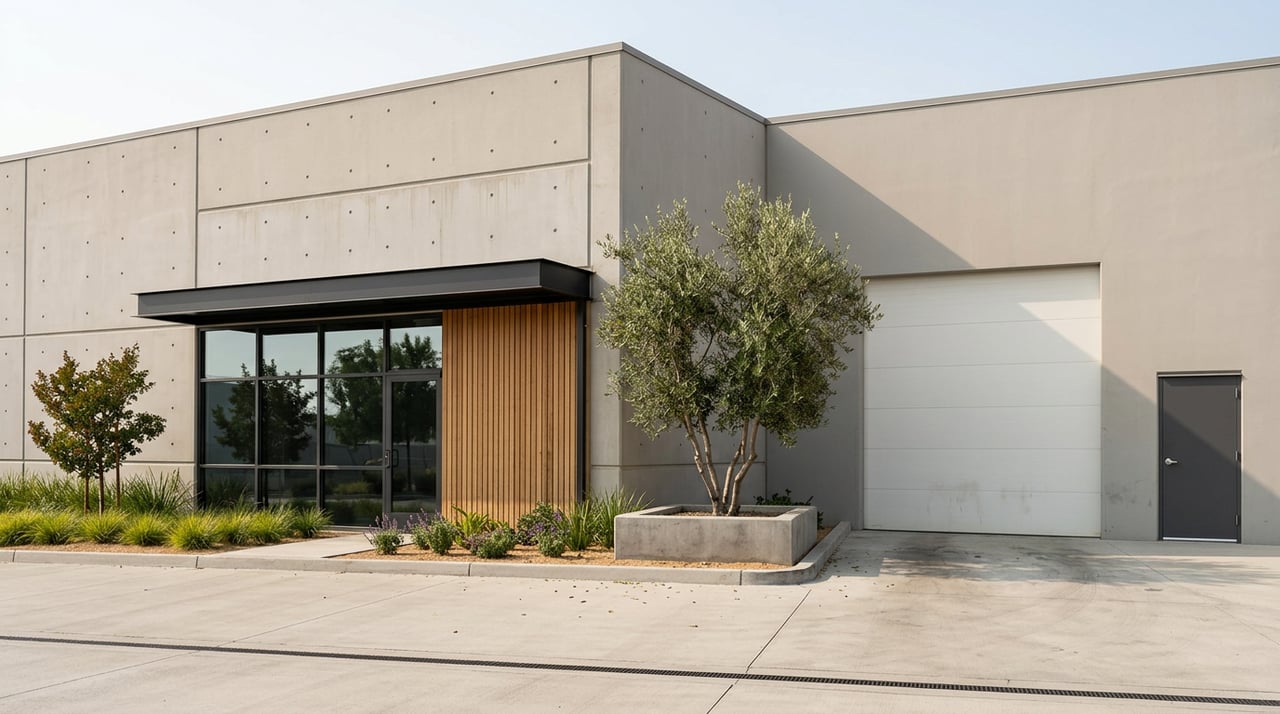
- Small‑bay industrial (under 10,000 SF per suite). Multi‑tenant parks that serve local makers, service firms, and contractors. Lease terms often run 3 to 5 years, with quicker re‑tenanting cycles.
- Mid‑bay industrial (10,000 to 50,000 SF). Suited to specialized manufacturers, assembly, or smaller logistics groups. Expect 3 to 7 year terms.
- Large‑bay distribution (100,000+ SF). Fewer in Fremont given land constraints. These tend to be long‑term leases for regional 3PLs and distributors, often 5 to 10 years or more.
- Flex and R&D. Higher office finish, more robust mechanicals, and features that support product engineering, light lab, and assembly. Rents are typically higher than a standard warehouse box in the same location.
- Advanced manufacturing. Modern buildings with significant power, heavier floor loads, taller clear heights, and upgraded fire protection. This is the focus of many recent Fremont deliveries to serve AI hardware and EV supply chains. The CBRE Bayside announcement above offers a representative spec snapshot.
Lease structures and what they mean for returns
Industrial deals often use predictable, investor‑friendly structures. Knowing how costs flow will help you price the rent, TI, and concessions correctly.
- Triple Net (NNN). Tenants pay base rent plus property taxes, insurance, and CAM. This is the dominant structure for single‑tenant and larger industrial and it can stabilize cash flow for you. For a plain‑English primer, see Ware CRE’s guide to industrial lease terms.
- Modified Gross or Base Year. Common in multi‑tenant small‑ and mid‑bay, and in flex or R&D. The landlord covers certain expenses to a base year, and increases are passed through. Learn how expense‑stop structures work in Area Development’s overview.
Lease length and TI shape risk. In the Bay Area, small‑bay terms often run 3 to 5 years, mid‑bay 3 to 7 years, while R&D and specialty manufacturing can stretch 5 to 10 years because of capital‑intensive buildouts. Underwriting examples in institutional filings commonly use tenant improvement allowances of roughly 10 to 40 dollars per square foot for standard industrial and higher amounts for advanced systems. New‑lease brokerage commissions are often underwritten around 5 to 6 percent of gross rent. See representative underwriting inputs in this SEC‑filed appraisal methodology.
Underwriting framework for Fremont assets
Use a simple, repeatable approach so you do not miss a key driver.
Market inputs to lock first
- Define a tight comp set by submarket and product. Focus on Fremont and the Oakland‑Hayward‑Berkeley industrial market, and match vintage, power, loading, and clear height. Broker quarterly reports and active listings can triangulate asking versus achieved rents. Start with the ranges in Kidder Mathews’ East Bay industrial report.
- Calibrate vacancy. If direct vacancy in the submarket prints 5 to 7 percent for your product, underwrite slightly above that for older assets and slightly below for best‑in‑class infill. This cushions volatility.
- Set realistic rent growth. Bay Area rent growth has moderated compared to 2021. A conservative 0 to 3 percent annual growth baseline is common. See trend context in Cushman & Wakefield’s Oakland MarketBeat.
Property‑level adjustments that move the needle
- Functional factors. Adjust rent up or down for clear heights, loading (dock versus grade), power, ESFR, and office finish. Advanced manufacturing power and 24‑7 ops often command a premium in Fremont. Recent deliveries that advertise 4,000 amp service are direct signals of tenant demand for heavy power. See the local spec example in CBRE’s Fremont project announcement.
- Deferred capital. Quantify roof condition, seismic work, electrical upgrades, paving, and HVAC. Underwrite an initial CapEx bucket and an annual reserve appropriate to the asset’s needs. Institutional examples often show modest annual reserves per square foot, but the property’s real condition should drive the number. Reference the SEC methodology example for how appraisals frame reserves.
- TI, downtime, and commissions. For standard industrial renewals, many underwritings assume 20 to 40 dollars per square foot of TI, plus 5 to 6 percent leasing commissions on new deals. Advanced manufacturing or lab‑like space can require higher TI and longer fit‑out time. Plan for realistic downtime between tenants.
Financial model must‑haves
- Effective gross income built from market rent by suite, less a stabilized vacancy and collection loss that fits product age and location.
- Operating expenses that reflect your lease structure. NNN pass‑throughs keep owner expenses lean, though you should include property management and structural items. Modified gross and flex assets carry a higher landlord expense ratio.
- Reserves and CapEx, as noted above, and clear TI and LC lines for both new deals and renewals. Many institutional examples allocate management fees near 3 percent of effective gross income. See examples in the SEC filing.
Exit and sensitivity analysis
- Entry and exit cap rates. Bay Area core infill industrial still commands premium pricing, yet cap rates have repriced upward from 2021. For top Class A infill with long terms, low to mid‑5 percent is a reasonable reference point from recent commentary. Secondary or shorter‑lease assets should price at higher yields. Stress test your exit cap 50 to 100 basis points wider than entry so you see the range of outcomes. For context on investor tone and cap movement, review Lee & Associates’ 2024 report.
- Simple math example. If your stabilized NOI at sale is 1,500,000 dollars, an exit at 5.25 percent implies a value near 28.57 million dollars. If the exit cap expands to 6.25 percent, value drops to about 24.00 million dollars. That is roughly a 16 percent decline, which is why you model multiple exit caps.
Due diligence checklist in Alameda County
Work through these items early so surprises do not derail the plan.
- Zoning and use. Confirm the site’s zoning and permitted uses within Fremont’s employment districts and overlays. The City’s economic development page helps frame permitted uses and process steps. Start with the City of Fremont overview.
- Power and utilities. Verify existing electrical service size, upgrade costs, and utility lead times. Heavy‑power tenants are common in Fremont’s advanced manufacturing scene, and upgrades can be both costly and time sensitive. See power specifications referenced in CBRE’s Fremont manufacturing park release.
- Environmental reviews. Many older industrial parcels across East Bay corridors may carry some level of environmental history. Budget Phase I and, if needed, Phase II, and price remediation into your project plan. For context on complexity near port‑adjacent areas, read Bisnow’s discussion of Oakland port industrial dynamics.
- Permitting timelines. Advanced manufacturing or lab‑like fit‑outs often require additional mechanicals and longer permits. Include this in downtime assumptions. Institutional filings provide examples of how to carry that risk in a model. See the SEC example.
- Tenant concentration and industry cycles. Fremont’s concentration in EV and AI hardware is a strength, but it can also create cyclicality risk. Stress test tenant credit and backfill timing.
- Market liquidity and comps. Transaction volume is lighter than the 2020 to 2021 peak, yet quality assets still move. A recent example is a 177,000 square foot Fremont warehouse trade at about 59 million dollars, which signals ongoing institutional interest. See details in Colliers’ sale announcement.
Example exit paths in today’s market
- Conservative. Stabilized NOI is flat and your exit cap is 75 basis points higher than entry. Terminal value may land 10 to 20 percent lower depending on the NOI level and cap movement. Model this explicitly so you understand downside IRR.
- Base case. Hold 5 to 7 years with 1 to 3 percent annual rent growth and an exit cap equal to or slightly wider than entry. Most of your return comes from the initial yield and modest NOI growth.
- Upside. If in‑place rents sit below market and you can re‑lease to the ranges noted above, marking to market plus growth can lift NOI by double digits ahead of sale. Pair this with a stable exit cap to show potential outperformance. For context on leasing trends by size and submarket, see CBRE’s Oakland industrial Figures.
What this means for your strategy
- Fremont offers durable demand for modern, power‑capable infill industrial and flex/R&D, supported by deliberate land use policy and a deep advanced manufacturing cluster. See policy and cluster detail from the City’s economic development page and local reporting.
- Rents and vacancy are product specific. Use the East Bay rent and vacancy ranges as a baseline, then adjust for power, loading, and finish. Review the latest ranges in Kidder Mathews’ report.
- Underwrite with discipline. Carry realistic TI, leasing commissions, and downtime, and run exit cap sensitivities of plus 50 to 100 basis points. Investor commentary shows cap rates have pushed higher from 2021 lows, so price risk accordingly with references like Lee & Associates’ report and Cushman’s Oakland MarketBeat.
If you want a hands‑on partner who can source deals, underwrite with investor‑grade rigor, and manage execution, connect with a local advisor who blends residential and commercial expertise to support your broader wealth plan. To discuss current Fremont opportunities or walk through a live model, reach out to Atef Ibrahim and start your real estate wealth strategy today.
FAQs
What are average industrial asking rents in Fremont in 2025?
- Broker reports for the broader East Bay show average asking rents in roughly the 1.30 to 1.62 dollars per square foot per month NNN range, with premiums for modern Fremont infill and advanced manufacturing product.
Which product types see the most demand in Fremont today?
- Power‑capable advanced manufacturing and modern flex/R&D are tight, while mid‑bay and small‑bay suites serving makers and service firms also perform well; big‑box distribution is more limited locally due to land constraints.
What lease structure should I expect on a Fremont industrial or flex deal?
- Expect NNN for single‑tenant and larger industrial, and modified gross or base‑year structures in multi‑tenant small‑ and mid‑bay or flex/R&D, which shifts some operating costs back to the landlord.
How should I budget TI, downtime, and leasing costs in Fremont?
- Many institutional underwritings use 10 to 40 dollars per square foot for standard industrial TI, higher for advanced manufacturing systems, 5 to 6 percent brokerage commissions on new leases, and downtime tailored to fit‑out and permitting timelines.
What local risks should I diligence before buying in Alameda County?
- Confirm zoning and permitted uses, verify power capacity and upgrade timing, order environmental assessments, plan for permitting timelines, and stress test tenant credit and industry concentration risk tied to EV and AI hardware cycles.